
SIP - Opportunity
“Finding gold in the mines of opportunity.” Carl
Recap, SIP – Problem
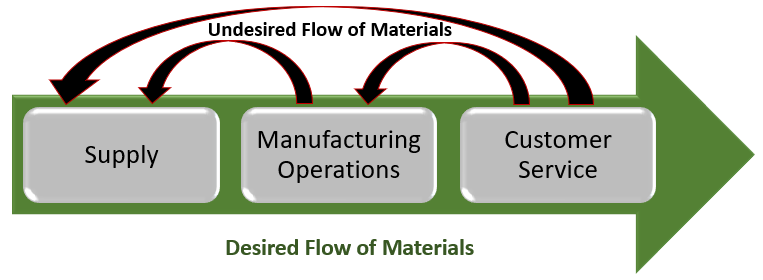
In the second post in this series, SIP-Problem, we dove into data of disruptions caused by poor material quality. Defined the term we call failure and the catalyst that initiated scaling SIP to an international landscape. The data on disruptions clearly showed an acceleration of disruptions to our customers, employees, and products. Then we used Pareto Analysis to identify 85 suppliers (out of 758) that were responsible for material nonconformances. The goal at this stage was to define and identify the sources of the undesired flow of materials.
At year 0, I wrote the white paper which kicked off the scale-up of the Supply Improvement Program, SIP. This is where the story begins, at year 0. SIP and data collection began 4-5 years previous…

Opportunity Data
While part quality is one measure (reviewed in the previous post: SIP-Problem) of the supplier’s ability to meet Mfg. Company needs, it is not the only requirement. Another measure is the financial impact. In this post, we will review our second task. To identify the costs due to poor quality.
In his book, Quality is Free, Phil Crosby coined the phrase, cost of poor quality or cost of non-quality. Crosby stated that quality does not cost money; rather, it is the absence of quality that costs the company and consumer. Crosby defined Cost of Poor Quality (COPQ) with four components:
Internal Failures – before delivered to customers.
External Failures – after delivery to customers.
Appraisal Costs – costs associated with ensuring conformance to quality.
Prevention Costs – incurred costs to reduce appraisal and failures throughout entire processes.
For our analysis, we did a pretty good job of pulling in all four pieces of information – to the extent available. For SIP we break down the COPQ this way:
Internal and External Failures = cost of the material.
Appraisal Cost = troubleshooting and repair time to return to normal state operation.
Prevention Cost = Product testing time and man-hours extension due to failure.
In most cases, the purchasing team was able to recover the material cost or replacement from the supplier; however, nearly all other costs were not recovered. Costs such as Shipping/Receiving, Inventory cycle times, delayed shipping, system downtime, and man-hours required to diagnose, fix, and replace a non-conforming part. As such, I used COPQ as an effective measure to determine actions. Also, I consider every failure an added and unforeseen tax to bottom line income. Therefore, every dollar we save increases net margin 1:1.
Once again, we pulled data from multiple cross-functional processes; finance, shipping, receiving, purchasing, manufacturing, and field service. Our focus in this segment is on the cost of disruption caused by supplied materials on three end-users: Customer, Employee, and Product. Said another way, when a disruption occurred, how much did it cost the company to make it right?
The cost to customer satisfaction and employee morale while somewhat subjective and dependent upon each disruption is very important and a driver to success. Of course, satisfaction and morale were very high on the list and we determine the best way to improve those two justifiable feelings was to eliminate or reduce the disruptions. Another factor we looked at closely was product RAM (reliability, availability, and maintainability). Once again, it was decided to focus on reducing disruptions. This program, SIP, does not capture the results of those secondary effects of disruption.
We faced many of the same challenges with data consistency as described in SIP-Problem. Our process was the same as described in SIP-Problem by pulling data from multiple sources and normalizing the data where possible. However, in this case, we analyzed at COPQ with a goal to understand the amount of ‘Gold in the Mine’ (shamelessly pirated this phrase from a former manager/mentor: thank you KP). How much can we save? At what point will our efforts not return value back to the company? Money is a narrow focus and is included in the larger picture of sizing the problem/opportunity and creating improvement.
When we look at the SiPoC Model - Supplier through Manufacturer to the customer we can identify a cost relationship. The farther through the process material flows, the costlier a failure becomes.

Opportunity
As stated earlier, Mfg. Company was experiencing an enormous amount of quality failures (issues). On average, the technical quality of the parts Mfg. Company receives from its suppliers was consistently above our goal of 99%. However, the small percentage of rejected parts resulted in 22,498 issues and $35,097,092 of unnecessary costs in the previous 5 years.
Think about that for a moment my friends. From only 1% of received materials, we had, on average, $7 million dollars of waste every year! I bet you are questioning your 99% good quality now, aren’t you?
In the ‘Picture This’ section, you also see the cost is accelerating. Overall, the average cost of each issue had soared as well; in year -5 each issue cost about $1,310, in year 0 the average issue cost ballooned to $2,554. It was estimated that by the end of year 0 the total cost of non-quality will exceed $10 million. Let me say it again, the Total Cost of Non-Quality will balloon by an additional $3 Million dollars above the previous 5-year average! That is the Gold in the Mine.
By the Numbers (COPQ – Cost of Poor Quality)
NOTE: Values shown below represent the previous 12 months, year 0 (unless otherwise noted).
$35,097,092 – the total cost of poor quality in the previous 5 years.
$10,000,000 – Projected minimum COPQ in year 0.
$7,798,440 – average annual COPQ tied to the supply chain.
$2,554 – year -1 average COPQ per event.
$1,560 – average COPQ per event for failing Technical Quality standards (previous 5 years).
758 – Total Direct Suppliers
$311 – Million dollars in direct supplier total direct spend.
85 – number of suppliers adding to COPQ.
65 – number of suppliers accounting for 80% of total direct spending.
36 – number of monitored suppliers which accounted for 68% of total direct spending.
5 – suppliers accounting for 41% of total direct spending.
Picture This


Summary
We have looked closely at two measures of supplier performance. One directly correlates to customer satisfaction (Number of Disruption) reviewed in SIP-Problem. The other, we just reviewed in this post, is to measure the Financial Impact (COPQ) on the business’s bottom line. Both measures drove decisions for corrective and preventive actions (CAPA).
The total cost of non-quality intrudes on the company’s ability to perform well and serve the customer. Resources that are planned to serve the customer are redirected to fix someone else’s failures. Those valuable resources are used to identify and minimize the unwanted COPQ tax on the company’s profits (for example, me and the teams I worked with). Profits that most companies will use to enhance future customer satisfaction by way of Research and Development of new products, developing current employees, and hiring and training new employees to make the customer experience even better.
In the blogs to come, I will continue to share the SIP methods used to dramatically reduce the supply issues and improve the relationships with your suppliers and customers.
Each week I will release/publish another blog based on the topics of SIP (Supply Improvement Program) as shown below. In the next post, I will share what was working and not working. I am willing to bet, you will see some of the same behaviors in your business. Then define the Solution (at least as initially proposed) and action plan to eliminate or, at least, minimize the supplier issues.